

We delve into three bills that were recently passed representing the largest public infrastructure spending program in U.S. history. First, we summarize the impacts of these bills, along with the emerging trends that will result.
Over the last couple of years, the Biden administration passed three Acts: The Infrastructure Investment and Jobs Act (‘IIJA’), the Inflation Reduction Act (‘IRA’) and the Chips Act (‘CA’). Collectively, these represent almost $1T dollars, the largest public infrastructure spending program in U.S. history. The primary intention of these Acts is to upgrade the aging infrastructure, spur renewable energy policies, and to make the U.S. a semiconductor manufacturing hub. They also aim to incentivize domestic manufacturing with policies such as the Build America Buy America (‘BABA’) requirements for construction materials that went into effect in November 2022. Over the next five years, with all else equal, the US economy could see an additional one to three trillion dollar increase in economic activity with over 2mm jobs added per year.
The Infrastructure and Investment Jobs Act
The IIJA will bring in $550B in new spending above baseline over the next 4 years. Although the total sum of the IIJA is $1.2T, the other $700B represents the normal spending by state agencies for which the federal government provides funding. Essentially there will be an increase in spending of almost 80%. Nearly one-third of the IIJA or about $400B will be spent on surface-level repair of roads and bridges. The U.S. transportation network includes 4.19 million miles of road, 48,756 miles of Interstate Highways, and 620k bridges. As these projects are expected to be completed by the end of 2026, which is fairly short in terms of infrastructure builds, priorities will likely be given to more shovel-ready jobs.
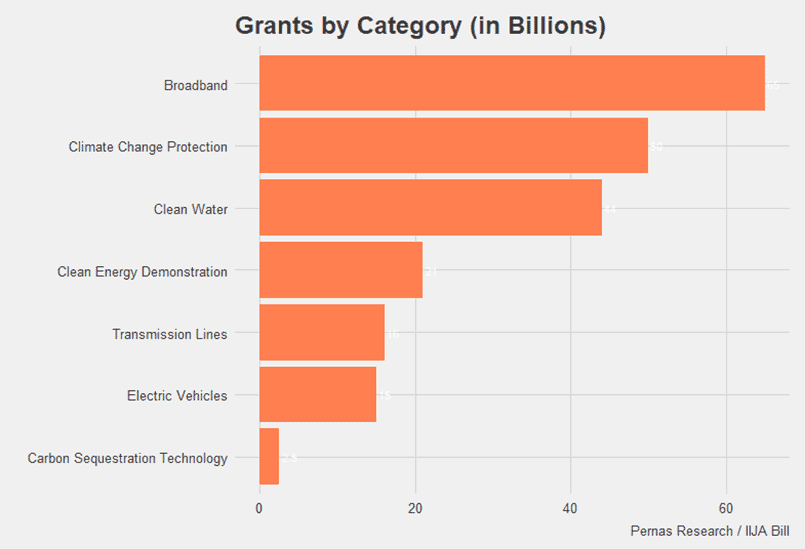
The IIJA funding will be distributed to the industries ex Transportation shown below:
The Inflation Reduction Act
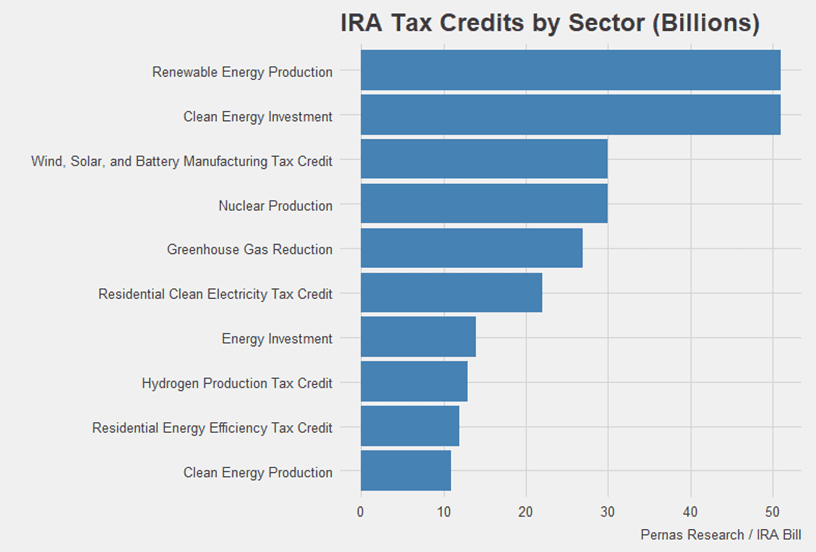
Although it is called the Inflation Reduction Act, the IRA will actually be funding industries such as Clean Energy, Carbon Capture etc., for the next decade. However, the majority of the funding is in the form of direct pay tax credits, aimed at incentivizing private market spending. These tax credits primarily target corporations with a smaller portion allotted for residential use. Approximately $370B will be allocated towards clean energy programs while another $300B will be direct towards deficit reduction initiatives such as expanding the IRS, taxation on 1% of buybacks, and a 15% minimum corporate tax rate on companies with greater than $1B in book income.
CHIPS Act
The United States relies on TSMC for 92% of its most sophisticated chips2. This extreme dependence on a foreign entity poses a national security risk. The Chip Act aims to address this concern with $39B in manufacturing incentives to establish at least two leading fabs in the U.S., along with an additional $11B for R&D to support and sustain the industry. The notion is to seed the semiconductor manufacturing environment, subsequently seeing a multiplicative effect from public and private investments. The impact of COVID underscored the vulnerability of the US semiconductor supply chain. Instances such as Ford plant employees only working 3 weeks in 2021 due to the semiconductor shortage were commonplace.
How funding works
Although the mechanics of how funding flows through to state and local levels differs for each bill, generally funding is approved at the federal level and is disbursed to states either through formula funding (non-competitive grants based on a predetermined formula using objective data) or through competitive grants (awards based on merits of applicants’ proposal on how they want the funds and how it will be used). The funding is not released in one lump sum but in annual disbursements via the omnibus appropriations bill. Formula funding for the IIJA is shown below.
There are also Discretionary Grants which are funding at the discretion of the granting agency. This gives significant authority to federal agencies to impose whichever du jour requirements they want and that applicants will be required to meet.
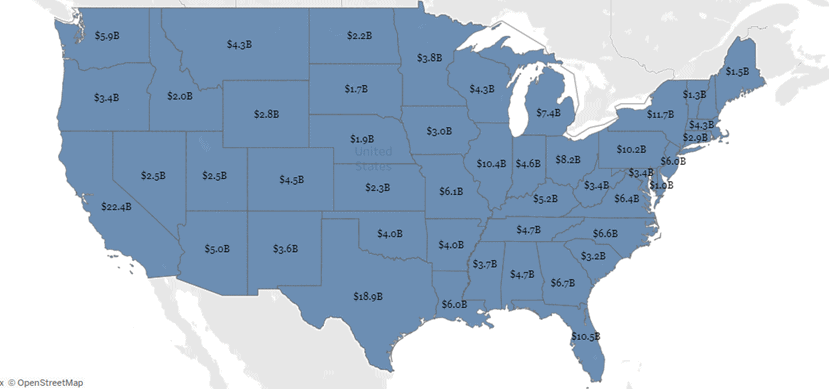
Source: GSA
Trends
Thus far about $80B has been allocated with most of it being through the Federal Highway Administration. Although it is hard to determine the precise impact these bills will have on certain industries, we believe in aggregate the sum is large enough that the tide will lift all boats- all one has to do is pick the right harbor. We have tried picking some of those harbors below by selecting industries in which the size of the funding amount is large compared to baseline levels. We define a trend as “A phenomenon that exerts an irreversible pressure on penetration rates for a good or service.” For more information on our writings on trends, see our paper HERE.
Trend #1 Electrical energy demand will increase as electric vehicle penetration grows. The IRA and IIJA will direct roughly $80b in funding towards EV manufacturing. EVs will put an additional 25-30% electric grid demand load at 100% penetration.
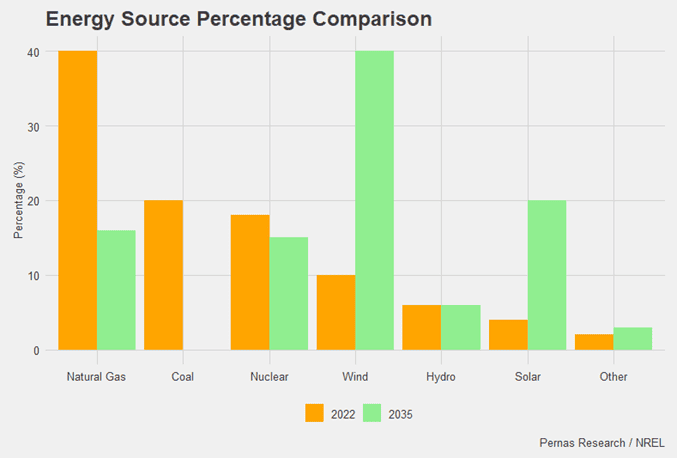
Trend #2 Wind energy generation will continue to increase as a share of total electricity generation. Currently wind generates about ten percent of the power needs of the USA -around 400 TWh -and by 2035 it is forecasted to make up 40%! The IRA will increase wind turbine manufacturing to 20 gigawatts per year by 2026 due to the 45x tax credit which grants credits to domestic manufacturers based on energy generation. This is an increase of almost 100% from today’s levels of around 10 GW.
Trend #3 More transformers and transmission lines will be needed for higher energy loads and as a larger percentage of electricity generation comes from renewables. Energy, especially from wind, will need to travel hundreds or thousands of miles from the Midwest to reach end customers. The DOE estimates that transmission capacity must increase by 60% in order to meet 100% clean energy by 20353. Other factors such as EV charging stations will also add to this demand. Having more robust distribution will also help with power outages which cost the U.S. …