

We run an internal concentrated equity portfolio and will always have a significant long bias for the simple reason that markets go up over time. We believe that if a country protects private property and allows its people to benefit from their hard work and creativity, then a stock market index that is reflective of the country’s underlying economy will trend higher over time. Despite this belief, we do not advocate for being fully invested at all times-- no equity portfolio is immune from large market sell-offs. Given markets are out-of-equilibrium systems prone to booms and busts, being fully invested is an inferior strategy to one that pares back risk when markets are fragile and takes more risk when markets are robust. Tactical shifts in risk-taking can help truncate downside portfolio moves in the event of a large market downswing while also helping to retain meaningful upside potential. This doesn’t just make our portfolio less volatile and more comfortable to hold, it enables us to have a higher terminal portfolio value at the end of a long investment horizon versus a similar portfolio that is 100% invested. In this paper, we describe the simple framework that guides our portfolio risk-taking approach. Part 1 will be dedicated to answering the question: How do we decide how much of our portfolio to put at risk and Part 2 will answer the question: After we decide how much risk we are taking, how do we manage this risk at the position level? (Note the crucial distinction between “risk-taking” and “risk management”).
How the Stock Market Behaves
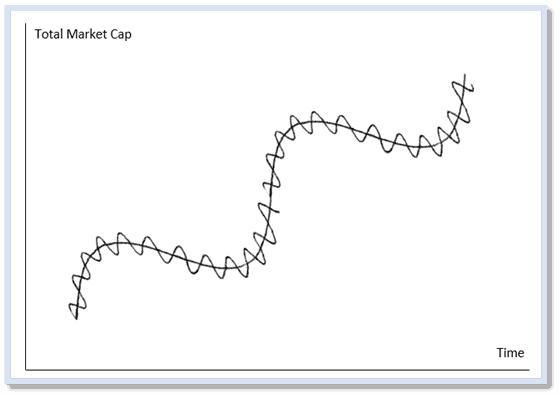
This is a stylized image depicting the sinusoidal fractal-like behavior of markets. Of course, in the real world, there are no such things as smooth periods or ones that are measurable ex ante. The purpose of this image is to demonstrate the cyclical nature of fear and greed cycles around an intrinsic-value based uptrend. Fear spreads to a point where excessive fear gives way to greed and greed spreads to a point where excessive greed gives way to fear.
On a daily, monthly, and yearly basis, we continuously ask ourselves: Given the prevailing investment landscape, what portion of our portfolio should be at risk? While this might seem like a straightforward question, the investment landscape has been muddled by a plethora of financial products that promise enticing returns with minimal risk. Examples include Core Bonds, Hedging Strategies, Market Neutral, Long Short Equities, Risk Parity, among others. Furthermore, Modern Portfolio Theory provides a theoretical framework (that is built on false assumptions) to justify using backward-looking statistics to build a neatly weighted combination of the entire investable universe. This leaves investors staring at a portfolio containing a myriad of asset classes, funds, and positions-- It is at about this point where we can safely say that they have long lost sight of the forest for the trees. They are left with a portfolio they don’t understand, the illusion of precision and a false sense of security about the risks they are taking. The only antidote is to have a correct and uncomplicated understanding of what part of your portfolio is at risk.
Our risk framework begins with a binary perspective that provides this simplicity. The investment universe is divided into two categories: Risk and risk-free. Risk introduces the potential for loss, and while countless ways exist to take investment risk, only two options offer zero investment risk: Cash and Treasury bills. Given this binary division of the investment universe, adjustment to our portfolio risk-taking allocation falls between two extremes, ~60% and ~125%. In other words, during periods devoid of opportunities, we allocate 40% of the portfolio to cash. This allocation offers protection in fragile market conditions and tactical liquidity during substantial downturns. Conversely, during periods of robust markets and opportunistic investment landscapes, we opt for modest leverage—about a quarter turn—enabling us to capitalize on favorable conditions. These extremes have been determined through empirical testing and theoretical exploration to strike the right balance between concave and convex risk-return profiles within a portfolio. Adjustments between the endpoints (60% and 125%) are influenced by our assessment of the two key pillars: Valuations and Fed policy. Our analysis of "risk factors" also plays an important role.
Valuations
Aswath Damodaran, a finance professor at the Stern School of Business and a contributor to valuation theory, likens valuation to "a life vest, a compass; it’s something for you to hold onto when everyone else is doing something different." In this context, valuation refers to a firm's intrinsic valuation, determined through the discounting of future cash flows. A full understanding of a company's industry and competitive positioning are necessary to project cash flows and apply an appropriate discount rate. As investors, intrinsic valuations are our primary focus but also the most challenging to unearth. In a dream world with ample time, we would perform this analysis for every publicly traded company. Once we calculate intrinsic values for each company and compare it to its market price, we would then rank all names and select those with the highest discounts for our portfolio. If we can easily build a diversified portfolio of names with healthy discounts to intrinsic value, we will be fully invested (Figure B). The less we find stocks trading at discounts and the tighter these discounts (Figure A) the less we will want to be fully invested.
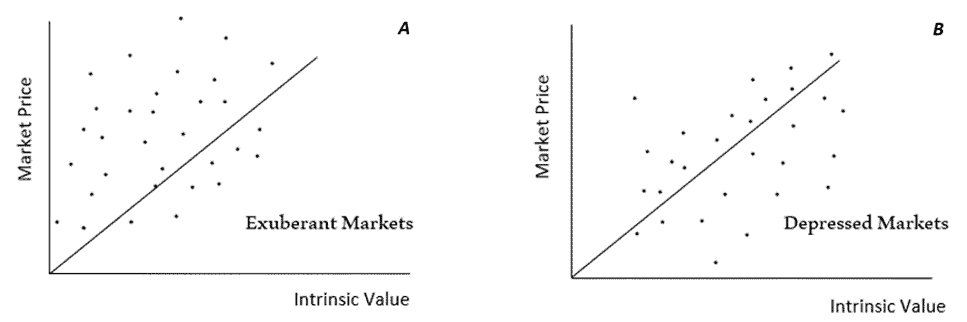
The above is a conceptual illustration and the diagonal line running through each graph is the efficient market line. Stocks above this line are trading at a premium and stocks below the line are trading at a discount.
Since we don’t live in a world where this exercise is possible, as a proxy for market opportunities we utilize insights from our bottom-up stock analyses which we believe is a representative sample of the larger economy. We buttress our bottom-up insights by utilizing broad market averages like price-to-earnings ratios and EV/EBITDA along with the prevailing level of …