| QTD | YTD | *ITD | |
|---|---|---|---|
| Pernas Portfolio* | 4.9% | 4.9% | 26.3% |
| S&P 500 | 10.6% | 10.6% | 14.5% |
| Russell 2000 | 5.1% | 5.1% | 7.8% |
| DJ Industrial Average | 6.0% | 6.0% | 12.4% |
The Pernas Portfolio achieved a return of 4.9% in the first quarter, compared to market averages ranging from 5.1% to 10.6%. The main detractors from our performance included Burberry, smaller-cap stocks, and a high cash position. In contrast, our gains were largely driven by strong performances in Meta, Rex American Resources & Arq. The most significant shift this quarter involved market expectations adjusting from predicting a series of seven rate cuts to now foreseeing only three. Sectors sensitive to interest rates, like real estate and utilities, rallied late last year due to a dovish stance from the Fed but have since underperformed compared to the broader market.
Despite easing in the shelter component of the CPI, large increases in auto insurance premiums have offset some of the disinflationary benefits from housing. The rising costs of servicing claims have significantly driven up premiums. Additionally, fueled by fading recession fears and escalating tensions in the Gulf, Q1 witnessed a 20% rally in oil prices. This spike in oil prices is another short-term setback in the Fed’s efforts to control inflation. (We strongly maintain our view that the structural dynamics of a stable money supply and low money velocity will continue to mitigate inflationary pressures. However, it is now becoming apparent that this trajectory will be accompanied by more volatile CPI figures).
The yield curve has now been inverted for 639 days, yet there is no recession in sight. In 2023, U.S. real GDP grew by 2.5%, and momentum has continued in Q1 driven by a robust labor market, burgeoning AI optimism, and re-shoring efforts supported by industrial policy. Over the past five months, the S&P 500 has surged nearly 30%, with very little downside volatility along the way. This rally, alongside the tightening of credit spreads for both investment-grade and high-yield bonds to their 2021 lows, signifies the complete departure of recessionary fears from broader market pricing.
Where we are searching for opportunities
Artificial Intelligence
We are of the view that AI technology is still in the first inning and are actively seeking companies poised to benefit from this trend. For example, in the first quarter, Alphawave (written about here) emerged as a potential candidate, riding the wave of accelerated networking trends where high bandwidth and low latency are imperative for AI’s training and inference workloads. However, their competitive positioning was difficult to gain conviction in. Despite AI’s significant hype, we believe the market is underestimating AI’s long-term impact. Thus far, the primary beneficiaries of this technological wave have been corporations such as NVIDIA, Microsoft, and Meta, along with hardware manufacturers and assemblers like Supermicro Computer, Vertiv, and Dell who have benefited from the data center build-out for AI workloads. We believe this marks just the initial wave of advancement with future leaders in novel use applications and entirely new industries still to emerge.
United Kingdom
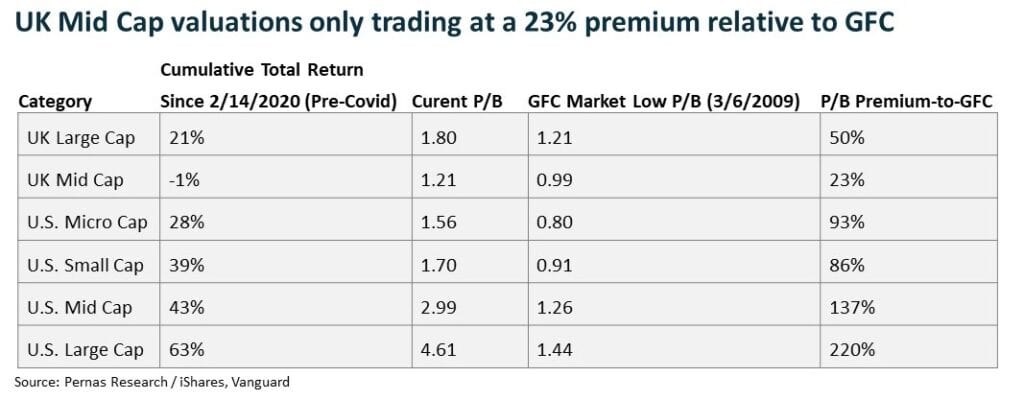
The UK remains a notable underperformer among developed economies, continuing to struggle with persistent Brexit-related issues. Inflation has been more stubborn than in the U.S., with real GDP growth hovering near zero. Despite our strong bias for U.S. stocks, compelling evidence suggests that UK stocks have been unduly punished. UK mid-caps valuations are currently trading at just a 23% premium above their 2009 lows, a rare occurrence indicating severely oversold conditions (see table below). Although there are several names under evaluation, currently our favorites are Doc Martens and Burberry, both trading well below 10x normalized P/E and both with significant growth potential.

U.S. Small Caps
Small caps have lagged behind U.S. large caps, with the Russell 2000 up less than half the S&P YTD. This underperformance is particularly pronounced in sectors burdened by rising debt servicing costs. Higher interest rates have a more significant impact on small caps, where ~40% of companies have variable rate debt, in contrast to just ~7% for the S&P 500. While credit spreads for the junkier credits (CCC and lower) remain around 300 basis points above their 2021 lows, those for higher-quality markets are very tight. This disparity creates opportunities to invest in indebted small caps that may be prematurely dismissed as “too risky.” In line with this, we have recently taken a speculative position in Red Robin (RRGB) and are continuing to search for other companies with similarly attractive risk/reward profiles.
INVESTMENT DISCLAIMERS & INVESTMENT RISKS
Past performance is not necessarily indicative of future results. All investments carry significant risk, and it’s important to note that we are not in the business of providing investment advice. All investment decisions of an individual remain the specific responsibility of that individual. There is no guarantee that our research, analysis, and forward-looking price targets will result in profits or that they will not result in a full loss or losses. All investors are advised to fully understand all risks associated with any kind of investing they choose to do.